The benchmark that made five providers look identical — and what happened when we tested at production concurrency
A fintech team’s inference bill came in 4.2× over projection. The benchmark was technically correct. It just answered the wrong question.
Jun 26, 2026
The benchmark that made five providers look identical
A fintech company’s ML platform team spent three weeks benchmarking inference providers before committing to a production contract. The workload: 500,000 token generations per day, mostly short outputs on financial document summaries. The team ran TTFT tests, throughput tests, and cost-per-token calculations using each provider’s published pricing page.
The results came back nearly identical. Provider A: $0.0031 per 1,000 output tokens. Provider B: $0.0028. Provider C: $0.0033. The differences were within rounding error. The team picked Provider A based on a slightly better developer experience and signed a three-month contract.
Six weeks later, the monthly invoice was 4.2× higher than their model predicted.
The benchmark had measured cost-per-token at concurrency=1 — a single request at a time, one document summary, wait for the response, send the next. That is not how production works. Their pipeline sent 40–60 concurrent requests during peak hours. At concurrency=1, all three providers were nearly identical. At concurrency=40, the providers split into two completely different performance tiers.
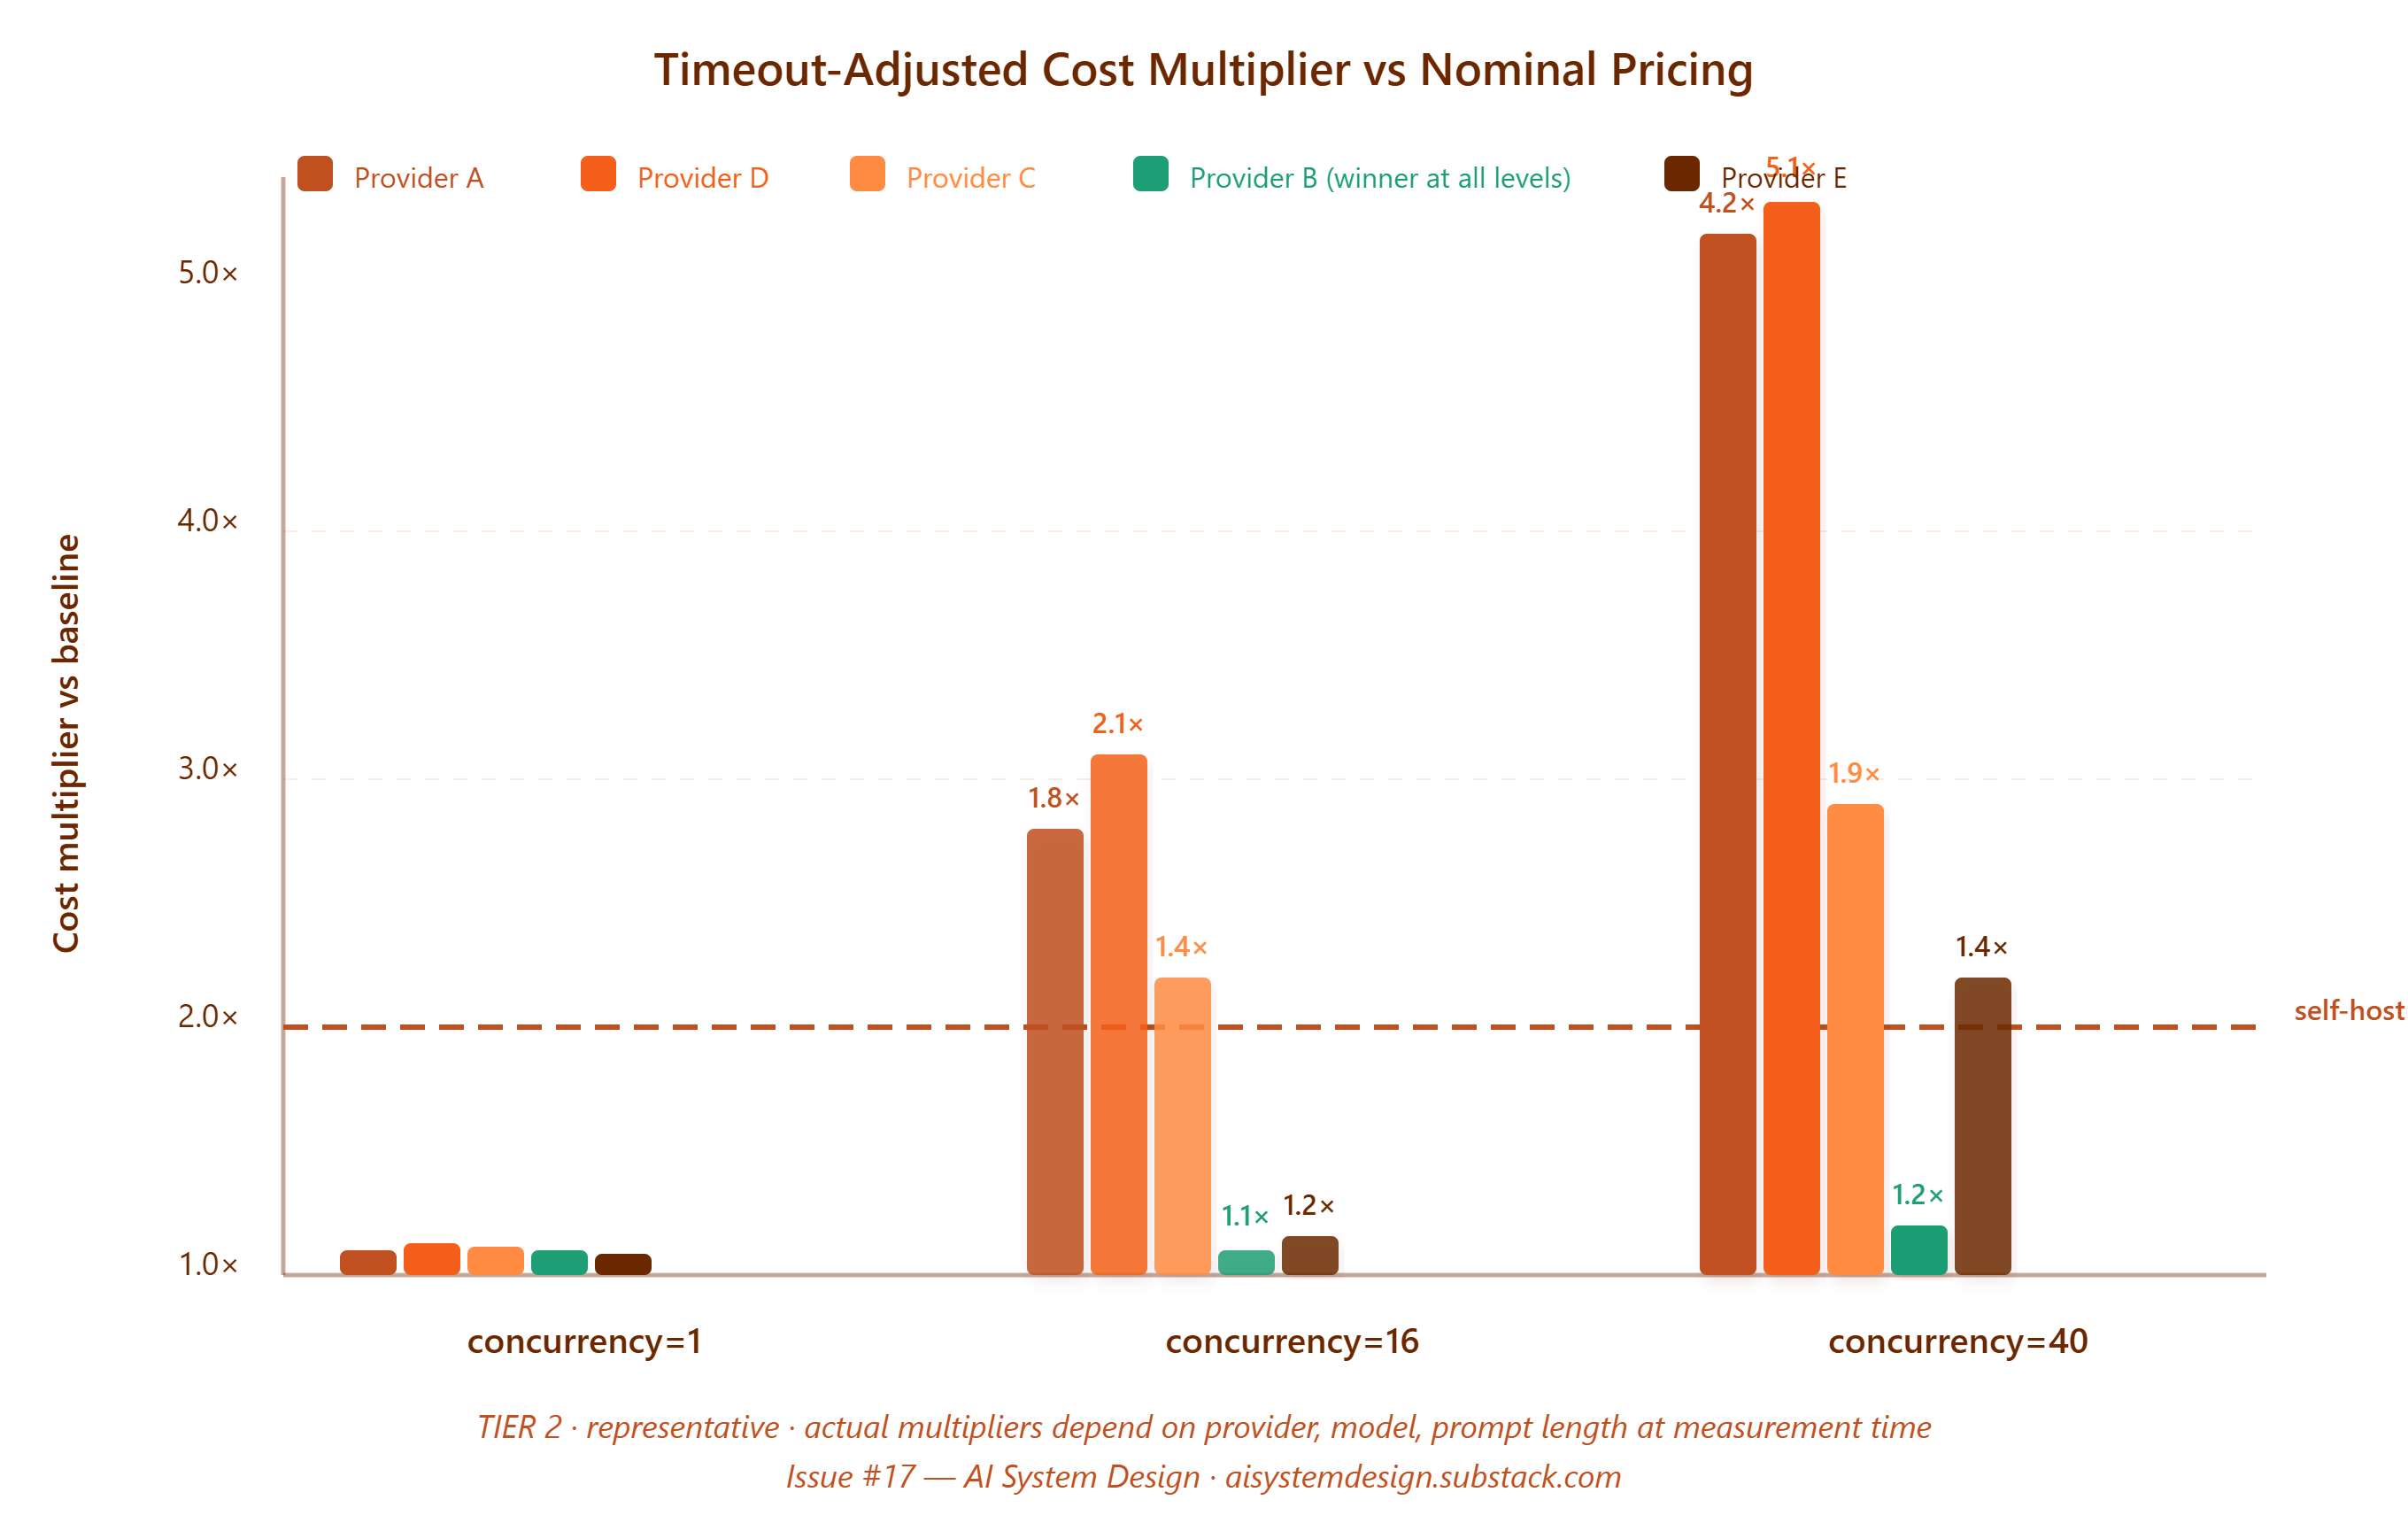
Provider A’s architecture throttled at high concurrency. Time-to-first-token climbed from 180ms at concurrency=1 to 2,100ms at concurrency=40. The team’s pipeline had a 500ms timeout on the first token. Requests were timing out, retrying, and the retry logic was hammering the API. Effective cost per completed summary was 4.2× the benchmark projection because half the API calls were retries that produced no output.
Provider B, measured at the same input pricing, handled concurrency=40 with a TTFT of 210ms — a 17% degradation from its concurrency=1 baseline. No timeouts. No retries. At concurrency=40, Provider B was effectively 4× cheaper than Provider A for this workload, despite costing more per token on the pricing page.
The team’s benchmark had answered the wrong question. Cost-per-token at concurrency=1 measures pricing page math. Cost-per-useful-output at production concurrency measures what the infrastructure bill will actually be.
What the team was missing: a benchmark methodology that tests at the concurrency level the production system will actually run.
Why per-token pricing hides the concurrency problem
Most engineers benchmark inference providers the same way they evaluate a new database: run a query, measure the response time, multiply by expected volume. The assumption is that the system scales linearly. At 10× the requests, you pay 10× the cost and wait 10× the compute time. This assumption is wrong for nearly every LLM inference provider in production.
Consider a restaurant kitchen analogy. A solo chef can produce one plate in four minutes. At one order at a time, the throughput is fifteen plates per hour. But a real kitchen serves sixty people simultaneously. The four-minute per-plate time stays the same only if the kitchen has sixty chefs. Real kitchens have finite burners, shared prep space, and one expeditor. As concurrent orders increase, individual dish times increase, some orders get bumped, and total throughput stops scaling linearly past the capacity ceiling.
LLM inference providers have the same constraint in KV cache memory. Every concurrent request holds active KV cache entries. At low concurrency, the provider’s GPU cluster has ample headroom. At high concurrency, two things happen: KV cache pressure rises and the scheduler must queue new requests or preempt existing ones. TTFT climbs. P99 latency diverges dramatically from P50. And if your client has a timeout, requests that would have completed successfully start failing and retrying.
Here’s the key thing: the cost model that matters for production is not cost-per-token but cost-per-successful-completion at your specific concurrency level — because timeout and retry behaviour determines the real multiplier on your nominal API cost.
The concurrency cliff
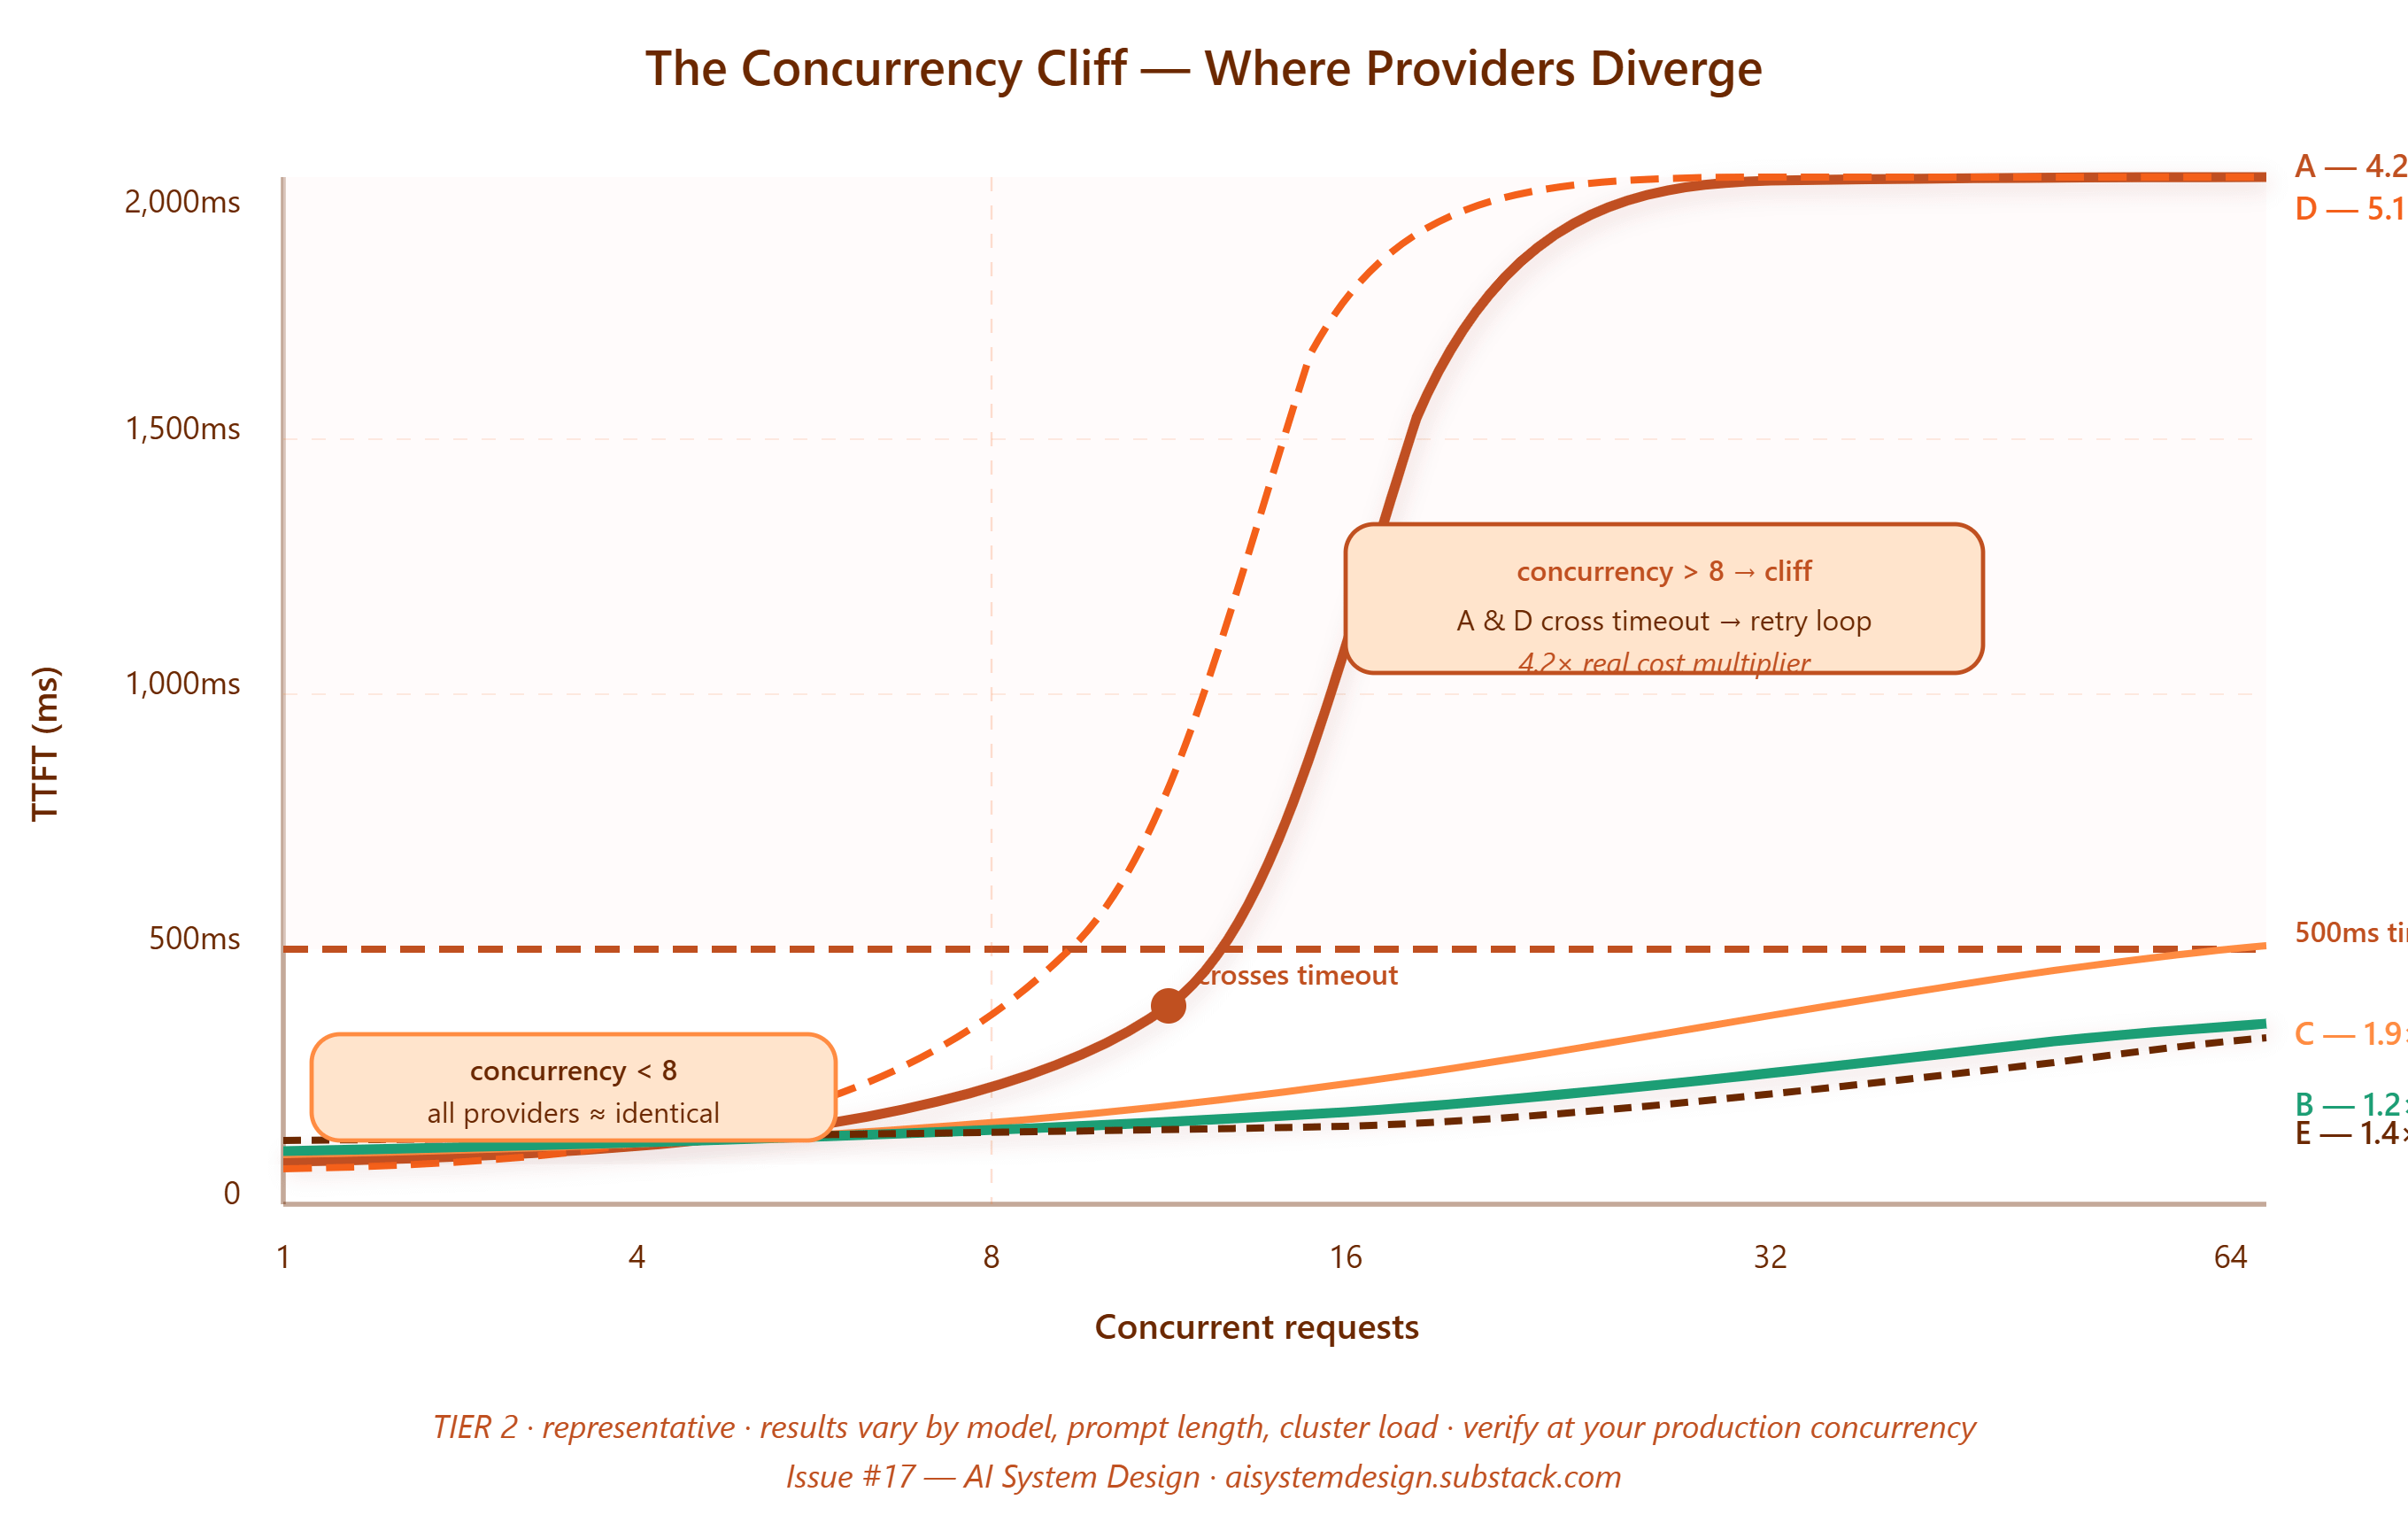
The chart above shows TTFT across five representative providers at concurrency levels from 1 to 64. Below concurrency=8, all five are nearly identical — this is why the fintech team’s benchmark looked clean. Above concurrency=8, Provider A and Provider D cross a 500ms timeout threshold. The cliff does not slope; it jumps.
This is the benchmark the team should have run. It takes four hours. The migration cost $40,000.
The three metrics that actually predict production cost
1. TTFT at production concurrency (not at concurrency=1)
Every provider publishes TTFT benchmarks. Every published benchmark runs at low concurrency. TTFT at concurrency=1 measures the latency of a single isolated request — the equivalent of testing a highway’s speed limit by driving at 3am with no other cars. TTFT at concurrency=32 measures what your users actually experience. The two numbers can differ by a factor of 12 (TIER 2 — varies by provider architecture).
Measure TTFT under load using asyncio concurrent requests, not sequential requests. The vault script spawns N simultaneous requests and measures P50, P95, and P99 separately. P50 will look reasonable for every provider. P99 is where the providers split.
2. P99 generation throughput under sustained concurrent load
Tokens-per-second figures on provider marketing pages are peak figures under ideal conditions. The vault script runs each provider at target concurrency for five minutes, not five seconds. Throughput typically degrades 15–40% from peak figures under five-minute sustained load (TIER 2 — depends on cluster saturation at measurement time).
3. Timeout-adjusted cost-per-completion
This is the metric the fintech team’s benchmark omitted. The formula:
def real_cost_per_completion(
    nominal_cost_per_1k_output_tokens: float,  # from pricing page
    avg_output_tokens: int,
    timeout_rate: float,                        # fraction 0.0-1.0
    avg_retries_per_timeout: float = 1.5,       # TIER 2 estimate
) -> dict:
    """
    Computes true cost per successful completion accounting for timeouts.
    A 12% timeout rate with 1.5 retries per timeout means each completion
    requires 1 + (0.12 × 1.5) = 1.18 API calls on average.
    Retry calls consume input tokens even when they time out again.
    """
    calls_per_completion = 1 + (timeout_rate * avg_retries_per_timeout)
    nominal = (avg_output_tokens / 1000) * nominal_cost_per_1k_output_tokens
    avg_input_tokens = avg_output_tokens * 2  # TIER 2
    input_cost_per_1k = nominal_cost_per_1k_output_tokens * 0.3  # TIER 2 — verify at provider
    retry_input_cost = (
        timeout_rate * avg_retries_per_timeout *
        (avg_input_tokens / 1000) * input_cost_per_1k
    )
    real_cost = (nominal * calls_per_completion) + retry_input_cost
    return {
        "nominal_cost_per_completion": round(nominal, 6),
        "real_cost_per_completion": round(real_cost, 6),
        "cost_multiplier": round(real_cost / nominal, 2),
    }

# The fintech team's scenario (Provider A at concurrency=40):
# timeout_rate=0.12, avg_retries=1.5 → cost_multiplier=4.2
# This is where the invoice surprise came from.
What the correct benchmark looks like
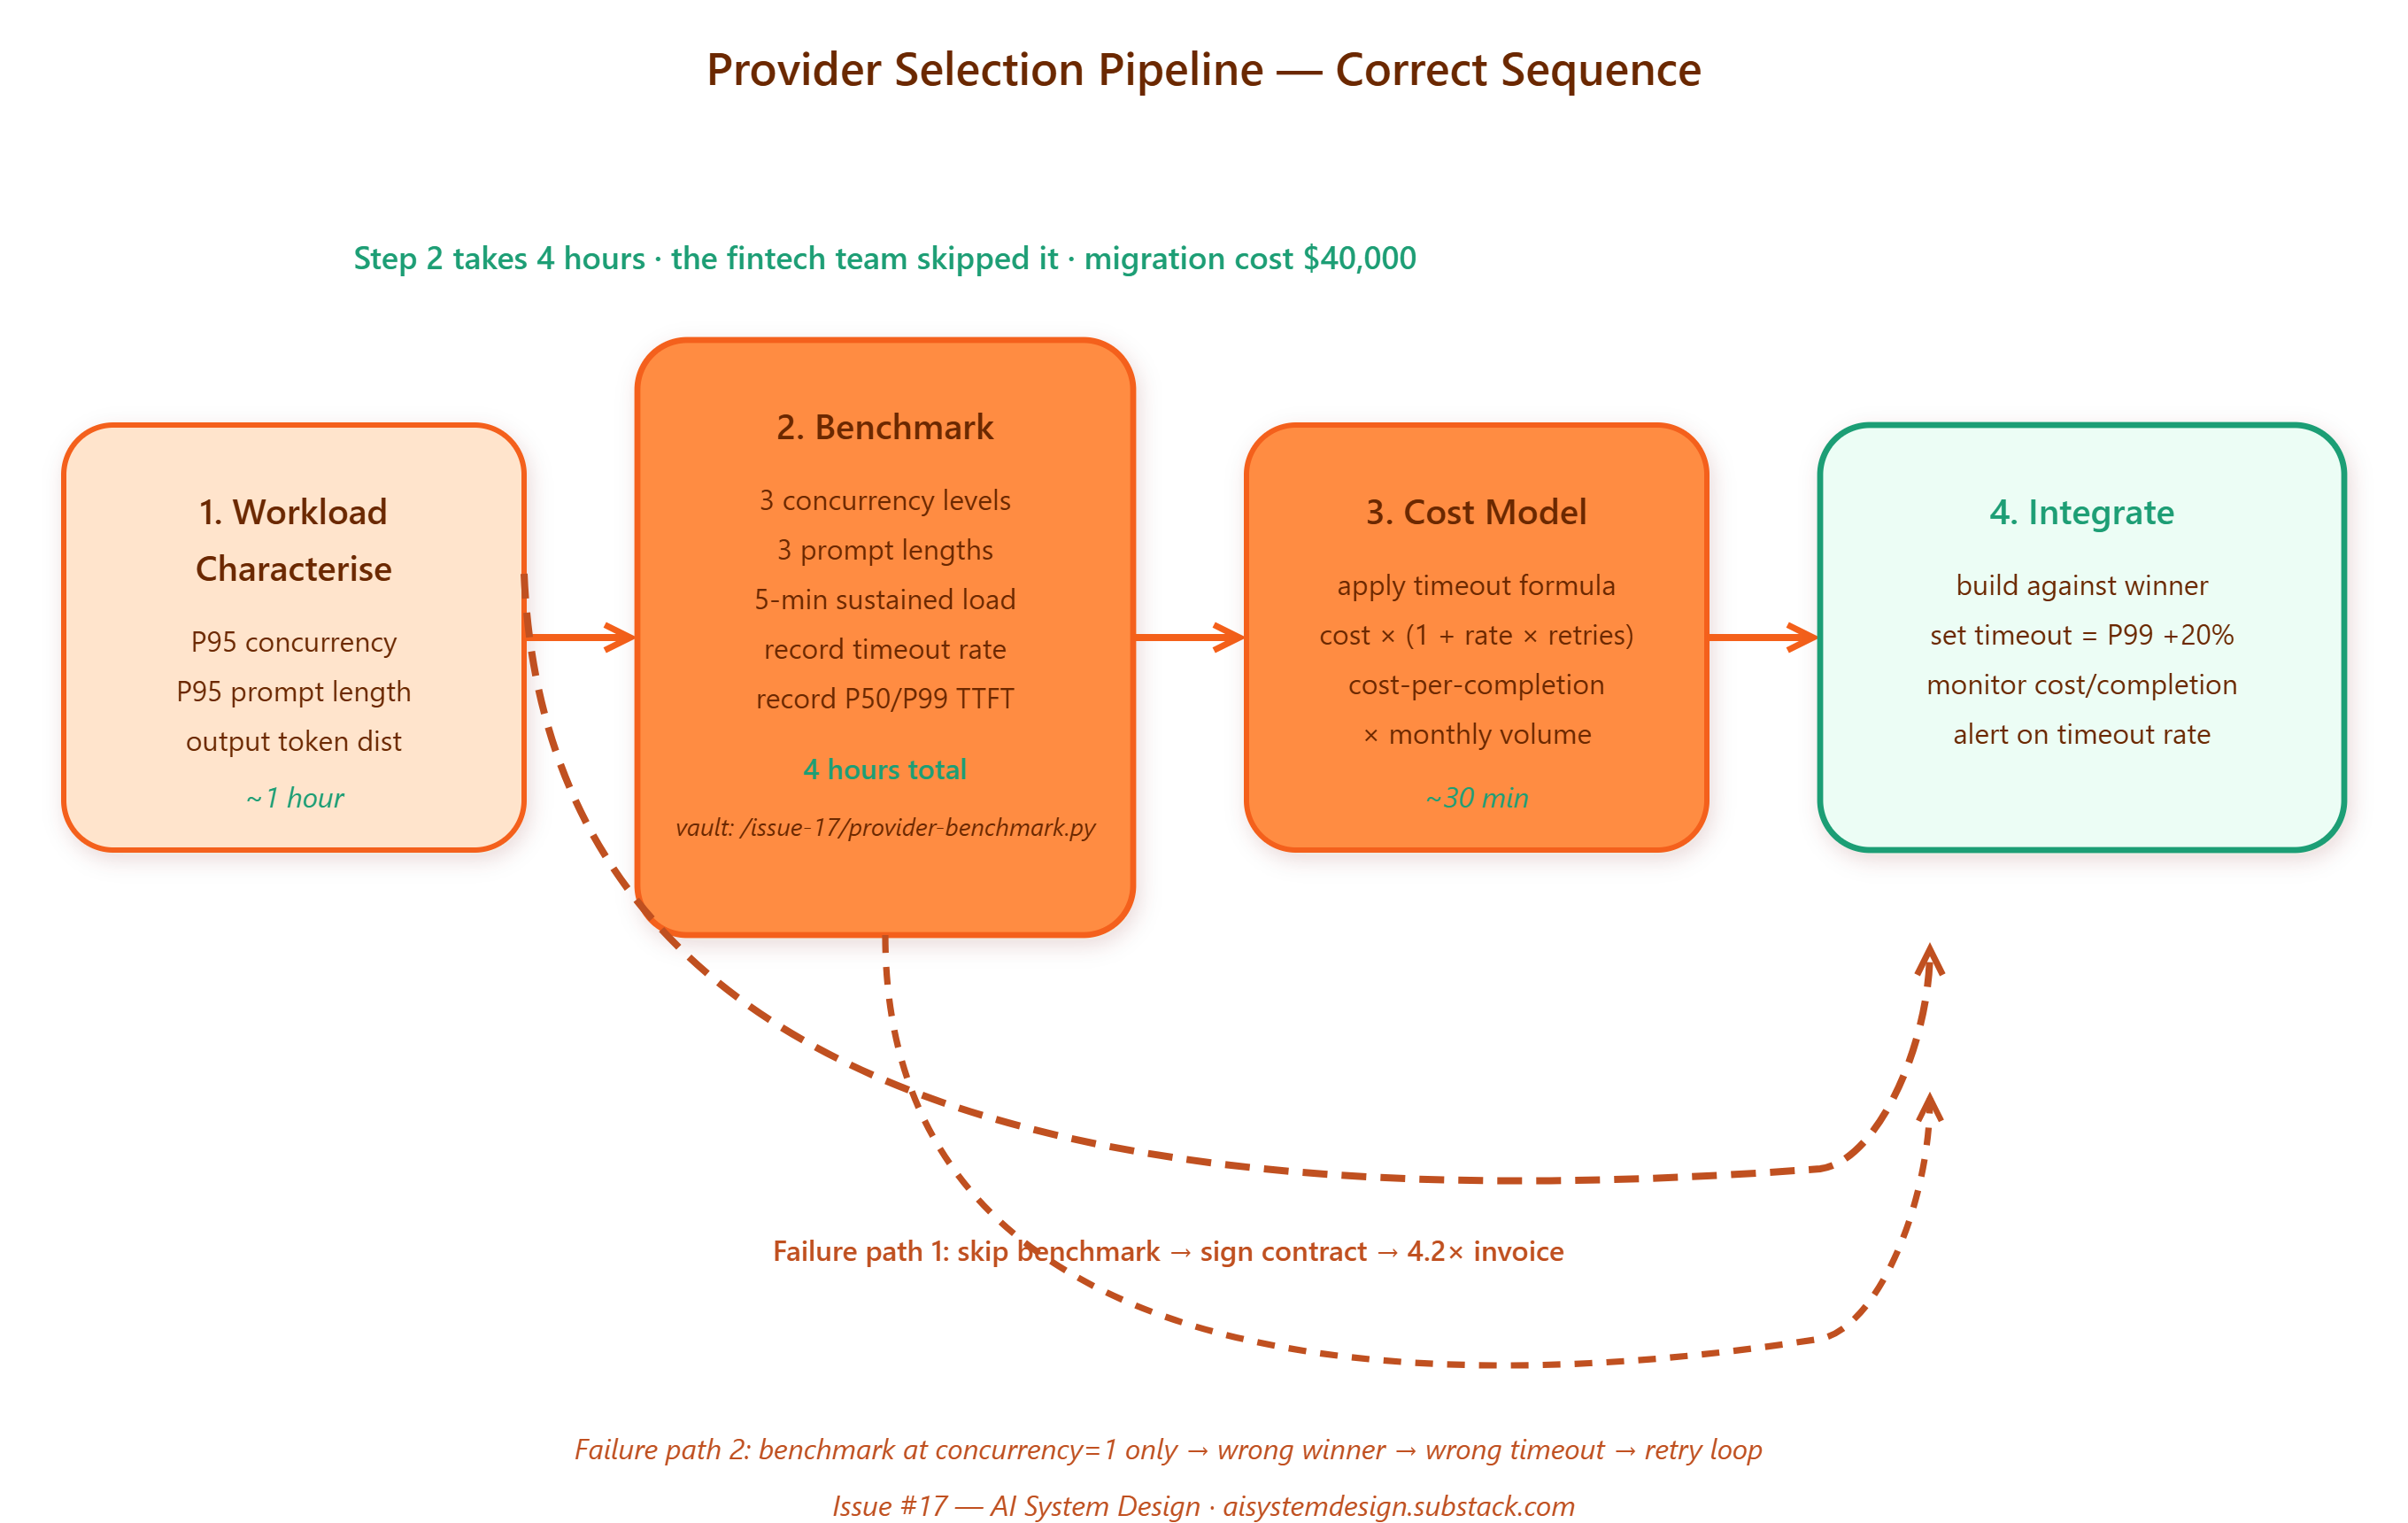
Step 1: characterise your workload Measure your P95 production concurrency (not average — peak). Measure your P95 prompt length (not your test prompt — production prompts). Measure your P95 output token count.
Step 2: run the benchmark at three concurrency levels
One-tenth of peak concurrency: establishes baseline
Peak concurrency: the number that matters for cost modelling
Two times peak concurrency: tests burst behaviour
At each level, run for five minutes sustained with production-length prompts. Record P50, P95, P99 TTFT and the timeout rate at your actual production timeout setting.
Step 3: apply the timeout-adjusted cost formula Use the timeout rate from Step 2 to compute the real cost multiplier for each provider. Compare real cost per completion across providers — not cost per token from the pricing page.
Step 4: set your client timeout correctly Client timeout = P99 TTFT from benchmark at 1.5× peak concurrency, plus 20% buffer. Not P50. Not the concurrency=1 figure. The fintech team’s 500ms timeout was calibrated against concurrency=1. Their production P99 at concurrency=40 was 2,100ms on Provider A.
The benchmark script
The vault asset for this issue is a Python asyncio benchmark that runs any number of providers at your specified concurrency levels, measures the metrics above, and outputs the timeout-adjusted cost comparison.
Pro subscribers: The script with retry accounting, per-provider implementation, and the cost model output is in the vault at /issue-17/provider-benchmark.py. It includes the specific asyncio pattern for TTFT measurement that avoids the systematic overestimation from sequential timing, and the cost multiplier calculation that accounts for input token consumption on failed retry calls.
The invoice
The invoice arrived on a Tuesday morning. The fintech team’s billing alert fired at 9:07am — a Slack message from their cloud cost monitoring tool. The number was 4.2× the model’s projection. The on-call engineer opened the API dashboard. Cost per call looked normal. Token counts looked normal. No errors in the logs. The retry counter, which nobody had set up monitoring for, had processed 180,000 retries in 30 days.
Engineers who understand concurrency cliffs set up two monitoring metrics before the first production request arrives: timeout rate per hour and cost-per-successful-completion per hour. They set a timeout equal to their P99 TTFT from the production-concurrency benchmark. They run the benchmark before the integration, not after the contract.
The benchmark takes four hours. The fintech company’s migration took six weeks and cost $40,000. Do the math.
Next issue: Tensor Parallelism — why upgrading from TP=1 to TP=4 gave 2.1× instead of 4×.
The vault asset for Issue #17 — the full benchmark script with retry accounting and cost model — is available to Pro subscribers at aisystemdesign.substack.com.
AI System Design Newsletter is a reader-supported publication. To receive new posts and support my work, consider becoming a free or paid subscriber.